

How reliable are Covid test results?
The most common way of testing for Covid has been PCR testing. PCR testing has been estimated (in Cohen 2020 meta-analysis) as having a false positive rate (FPR) of 2.3%. This is the percentage of known negatives that will receive a positive test result. The interquartile range on this estimate was 0.8% to 4.0%. The same study estimated a false negative rate (FNR) 0f 20%, with a wide range of possibilities from 0% to 40%. This is the percentage of known positives that will receive a negative test result.
This may not sound too bad. However, these two rates alone do not tell us much about the reliability of the test results. The statistic we want is the Positive Predictive Value (PPV): the likelihood that a given positive test result is accurate. We can derive the PPV from the FPR and FNR, but it requires making an assumption about the prevalence in the population being tested.
High Prevalence
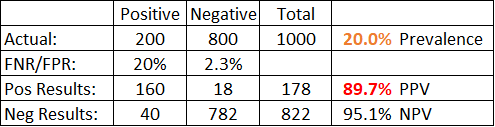
For example, in the table above, we have assumed a prevalence within the population being tested of 20%. If you are testing for SARS-CoV-2 and your test population is people sick in hospital with a respiratory illness, this may be a reasonable assumption. We test 1000 people, so 200 are real positive cases. The FNR means 40 of the 200 real positive cases will get a (false) negative result. The FPR means that 18 of the 800 real negative cases will get a (false) positive result.
Now we can calculate the PPV by dividing the number of real positive results by the total number of positive results: 160/(160+18)=89.7%. If you get a positive result, there is a 90% chance that it is accurate – so take it seriously. We can also calculate the Negative Predictive Value (NPV) by dividing the number of real negative results by the total number of negative results: 782/(40+782)=95.1%. If you get a negative result, there is a 95% chance that it is accurate – so rest easy.
Medium Prevalence
So far, so good, but now look what happens if we assume the prevalence in the population being tested is lower.
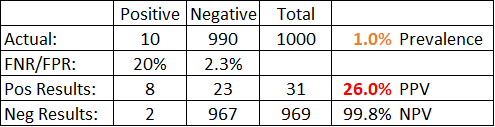
In the table above, we have assumed a prevalence within the population being tested of 1%. If you are testing for SARS-CoV-2 and your test population is anyone in the general population with symptoms, this may be a reasonable assumption. Here, with the exact same FPR and FNR as before, we find a Positive Predictive Value of only 26%. If you get a positive test result, there is a 74% chance that it is inaccurate, so it can’t be relied on.
Lower prevalence in the tested population is what makes the test unreliable. In the example above, there were only 10 real positive cases to find, so any good the test did in identifying the real positives was overwhelmed by the 23 false positive results coming from the many real negative cases. A positive result is not reliable, but a negative result is highly reliable, with a NPV of nearly 100%.
Low Prevalance
With the government now planning to test 3 million schoolchildren twice a week, the prevalence within the population being tested is going to be even lower than 1%. How many schoolchildren are showing symptoms of covid right now? It will be more like 0.1% than 1%, so let’s use that. Let’s also increase our test population size from 1000 to 3 million.
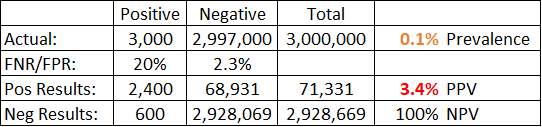
Now it can be seen that a positive result is virtually meaningless. There is only a 3.4% chance you are among the 2,400 true positive cases; you are much more likely to be in the 68,931 false positive cases.
Not only is an individual positive test result almost meaningless now, it also means the reported case numbers are vastly overestimated. In this example where prevalence was 0.1%, there were 3,000 real cases, but 71,331 positive test results, i.e. reported cases. The reported figure would be 24x higher than the real figure. The accuracy of the reported case numbers is thus largely dependent on how many people are being tested and who they are. They can be manipulated at will by changing the testing regime.
Lateral Flow Test
An alternative to PCR testing is the Lateral Flow Test (LFT). This is a viral test like PCR but gives quicker results. The UK government is now planning to test 3 million children aged 11-16 twice a week to see if they have SARS-CoV-2, and they will be using LFT.
The FPR for the LFT has been estimated as only 0.32%, which is much better than the PCR test. The FNR is estimated as 23.2%, which is worse than the PCR test.

However, as we can see from the table above, this does not help much. Even when a test is very good, it doesn’t help much when the prevalence is low. A positive test result is very unlikely to indicate a real case, with a PPV of only 19%.
Conclusion
The government’s new expanded testing regime says that any schoolchild that tests positive (in either of their two weekly tests) must isolate for a fortnight. This is despite a 80+% chance that a positive test result is wrong. Even a very good test cannot give reliable positive results when the prevalence in the tested population is low, as it is in schoolchildren.
The costs of this policy will be huge: not only in the disruption to the lives of the individual children falsely testing positive (and their families), but by conditioning all schoolchildren to believe that their freedom is dependent on compliance and permission granted by the state. It is dangerous to create a generation of children who passively accept that the state can take away their freedom at any time, simply based on the result of a medical test.
All mass testing for SARS-CoV-2 should be stopped immediately, especially this absurd policy of testing all schoolchildren twice a week.